We often speak about connectivity as a key function of healthy places and its importance to walkability, but how can we meaningfully demonstrate how an existing barrier or a proposed project impacts connectivity?
To imagine the spatial concept of connectivity in everyday life, take the perspective of a person standing on a given segment of street within a wider network of streets. How directly can you access any given point within the street network? Do you have multiple direct route options? Or limited and circuitous paths? Could you throw a stone to your desired destination, but must instead walk a half-mile to a safe crossing?
Connectivity is a concept that is easy to feel; we feel it in the form of frustration, or the reverse, in the satisfaction of a shortcut in a familiar space. But being able to quantify and visualize connectivity, poor or improved, and its impact on communities can be a powerful tool to understand a place, inform decision-making and tell a story of project impact.
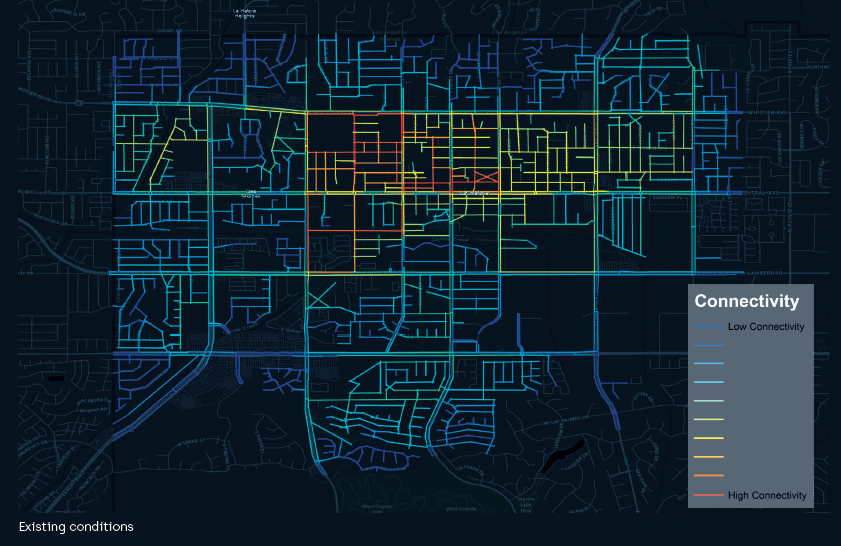
By measuring the relationship of a street segment to other streets in its network of proximity, the connectivity analysis provides a quantification of the ease and ability for a person on any given street segment to access locations on nearby streets. This is represented visually as a connectivity “heat map” where areas in red are the most connected and areas in dark blue are the least.
Steer recently used this tool to identify gaps and evaluate the impact of adding crossings on arterials in La Habra, California.
In the connectivity analysis of existing conditions, arterials appeared to be a significant barrier, with level of connectivity shifting dramatically from one side of an arterial to the next. Connectivity was found to be highest within the grid in the center of the city, while the bordering neighborhoods with limited access points and circuitous streets tended to have poorer connectivity.
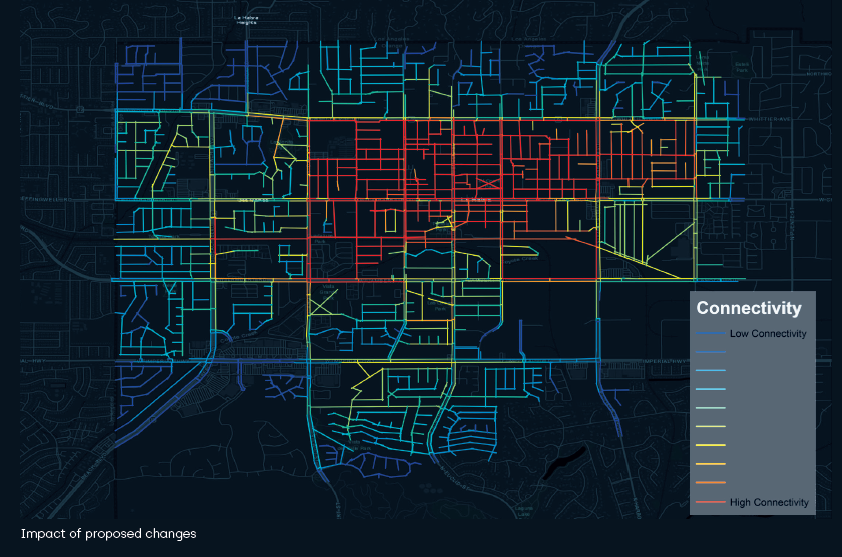
Following the identification of arterials as key barriers to connectivity, 80 test crossings were added in this model in locations and frequencies that aligned with local context, the city’s bicycle master plan, traffic volumes and locations of key destinations such as schools and parks.
The impact of new crossings is starkly portrayed in the connectivity heat map. Connectivity within the core center of the city is most dramatically improved, where vast areas are shown to have high connectivity compared to only a few streets before. An added multi-use trail along a lightly used railroad right-of-way transforms a former barrier into a connection between north and south.
The dramatic impact of crossings in the core grid is contrasted by the milder improvements on connectivity for hillside and walled-off communities; indicating these neighborhoods are not only limited by the arterials but also by their own form. Addressing long-term connectivity through development standards is a takeaway raised by this contrast in impact.
Ensuring that street design responds and is sensitive to real-world conditions is important for improving connectivity in a way that is meaningful and truly safe for pedestrians. While the results of the analysis point to a very exciting outcome of improving connectivity across arterials, some key considerations that are not captured in the analysis must be taken into account:
- The dramatic improvements to connectivity are achieved with the implementation of crossing projects as a network, rather than implementing a crossing in isolation.
- Ensuring safe design appropriate for street context, volumes and speeds, visibility and lighting is essential.
The analysis results clearly link projects to improved connectivity, but how do these results translate into real value for communities?
- Safe and inclusive streets: When the streets are designed to be safe and accessible by taking into account users of all ages and abilities they are better for everyone. Barriers to connectivity impact users with different levels of magnitude.
- Healthy communities: Creating environments that encourage walking and biking, and that help residents connect to other areas of their community without needing to get in their car, can improve physical and mental wellbeing.
- Good for local businesses: Particularly for small businesses, being located on a walkable street that is connected to the surrounding community can help businesses connect with customers.
- From isolated to integrated: Busy arterials with many lanes and infrequent crossing points create significant barriers between different neighborhoods, places of business, parks, schools and other destinations. Improving these connections is important to supporting a thriving community.
- Travel behavior: Connectivity plays closely into choice; both in terms of determining the route options that can be chosen, and in turn, by influencing the means by which an individual chooses to get there. By playing an important role in transportation decision making, connectivity also influences travel habits, and ultimately long-term travel behavior.
Written by Sarah McMinimy