The data that can be obtained from Smartcards (including the Oyster card) is the transport equivalent of the Tesco Clubcard. It provides detailed transaction data, as well as data collected at the point of application and registration. To illustrate, we provide two simple examples below from publicly available Oyster Card data.
Example 1
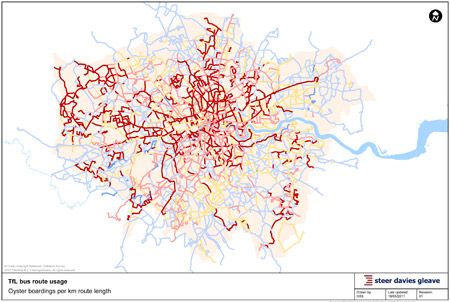
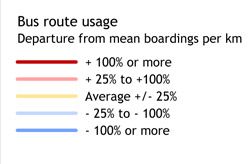
The first example is spatial data for London buses. It illustrates the relative volume of passengers on routes across London, by plotting the average number boardings per route kilometre, and for each route whether this is above (red) or below (blue) average. This is just the tip of the iceberg of the available data, which can be broken down by time, individual route, route frequency and type of buses used on the route.
FIGURE 1: RELATIVE VOLUMES OF BUS BOARDERS
Example 2
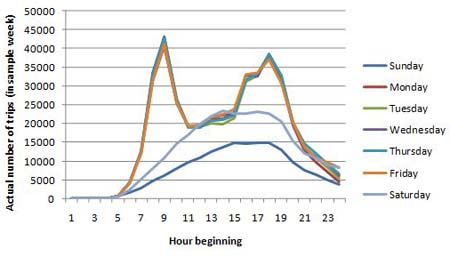
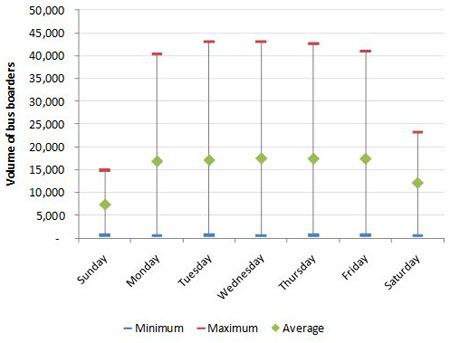
The second example focuses on the time dimension, and shows the profile of the volume of bus trips over a sample week. This shows the pattern across the day, and also between days of the week: Figure 2 shows the profile of the volume of trips over the week, while Figure 3 shows the range and mean by day of week.
FIGURE 2: VOLUME OF BUS BOARDERS OVER THE WEEK
FIGURE 3: RANGE OF BUS BOARDER VOLUMES BY DAY OF WEEK


